

Founded in 2001 by Eric Hémar and Christophe Satin and listed in 2012, ID Logistics is a leading global third-party logistics provider (3PL). Simplistically, 3PLs run warehouses for other companies. IDL designs a dedicated site for one client, hires and trains the workforce, implements technology including software, robotics, and automated systems, prices every task on a contract tariff list, and operates the site for five to six years at a time, renewing more than 95% of the time. Complexity brought-about by e-commerce, software, automation, and AI are driving secular growth in outsourced 3PL services. The most comparable company is Brad Jacobs’ GXO Logistics. IDL operates ~450 sites in 19 countries for leading companies including Amazon, Carrefour, Danone, IKEA, Nespresso, and Auchan, and generates €3.7bn in revenue. In contrast, GXO operates ~1,000 sites in 26 countries and generates $13.2bn in revenue. Since going public, IDL has grown revenue 16% CAGR, mostly organic. Revenue mix is 26% France, 48% Europe (ex. France), 19% North America and 7% rest of world.
Investment Case
What is the Moat?
References, Brand, Reputation, Track record. Warehouses are typically mission critical to driving a customer’s sales, customer experience, and margins and there are significant upfront costs which is why customers choose to outsource to companies like IDL with a demonstrable track record backed by strong references. IDL is a European leader with blue chip references like Amazon, Danone, and Carrefour. To give a hard example, IDL was invited into Amazon’s first French tender in 2017 because of its strong e-commerce references and now runs Amazon operations in six countries, which in turn, act as the reference for every other e-commerce warehouse across Europe.
Labor Management. A warehouse’s operating costs are 50% labor and IDL operates in unionized labor markets like France where it is difficult to scale labor up and down, part of the reason why customers prefer outsourcing. IDL scale and expertise give it a durable advantage. Permanent staff are pooled across clients with opposite seasonality — management describes pairing a Kingfisher-style summer DIY peak with a Toys-R-Us-style Christmas peak so the same workforce stays productive year-round, something captive warehouses cannot easily replicate. To the extent there are gaps in demand, roughly 28% of the workforce is temporary and can flex down.
Technology Expertise. IDL is deliberately Warehouse Management System (WMS) agnostic: it develops on Manhattan, Reflex, Generix, or the client’s own system, rather than push proprietary platforms. That flexibility wins tenders — roughly half of clients insist on keeping their own systems — and by management’s account it is how IDL won IKEA’s e-commerce logistics across Northern Europe on IKEA’s in-house Astro system. On automation, IDL can work with a diversified robotics bench (AutoStore-class cube storage, Scallog/Knapp-class goods-to-person robots, autonomous mobile robots (AMRs)) with experienced field engineering staff who can design sites, benchmark vendor claims, and preserve flexibility. These skills are clearly becoming more valuable with the rise of AI robotics. The result: about 30% of IDL’s sites are automated (company disclosure) against roughly 10% of warehouses industry-wide (peer-primer estimate) and this ratio should trend higher over time.
It is important to note that 3PL’s are a capital-light business. While 3PLs often lease the actual warehouse on behalf of a client, those leases are co-terminous with a client contract. A 3PL’s role is akin to an IT consultant but rather than advise and manage technology, they advise and manage logistics.
What is the bull case?
Long runway for double digit organic growth driven by 1) outsourcing and 2) automation. Approx. 50% of warehouses in Europe are still in-sourced (management’s estimate; the penetration data of Armstrong & Associates (A&A), a logistics-market research firm, points the same direction). However, increased use of warehouse management software, automated picking and packing systems, and more recently robotics means even large companies like Danone can’t retain and develop this type of expertise in house. These secular forces drive 4-6% growth for the 3PL market (2-3% volumes plus 2-3% outsourcing, per management’s decomposition) and even faster growth for leaders like IDL that have proven references. Revenue compounded 17.9% a year over the last five years (2020-25), grew 16.0% like-for-like in 2025 and 17.2% in Q1 2026, against 2026 guidance of 11-13%.
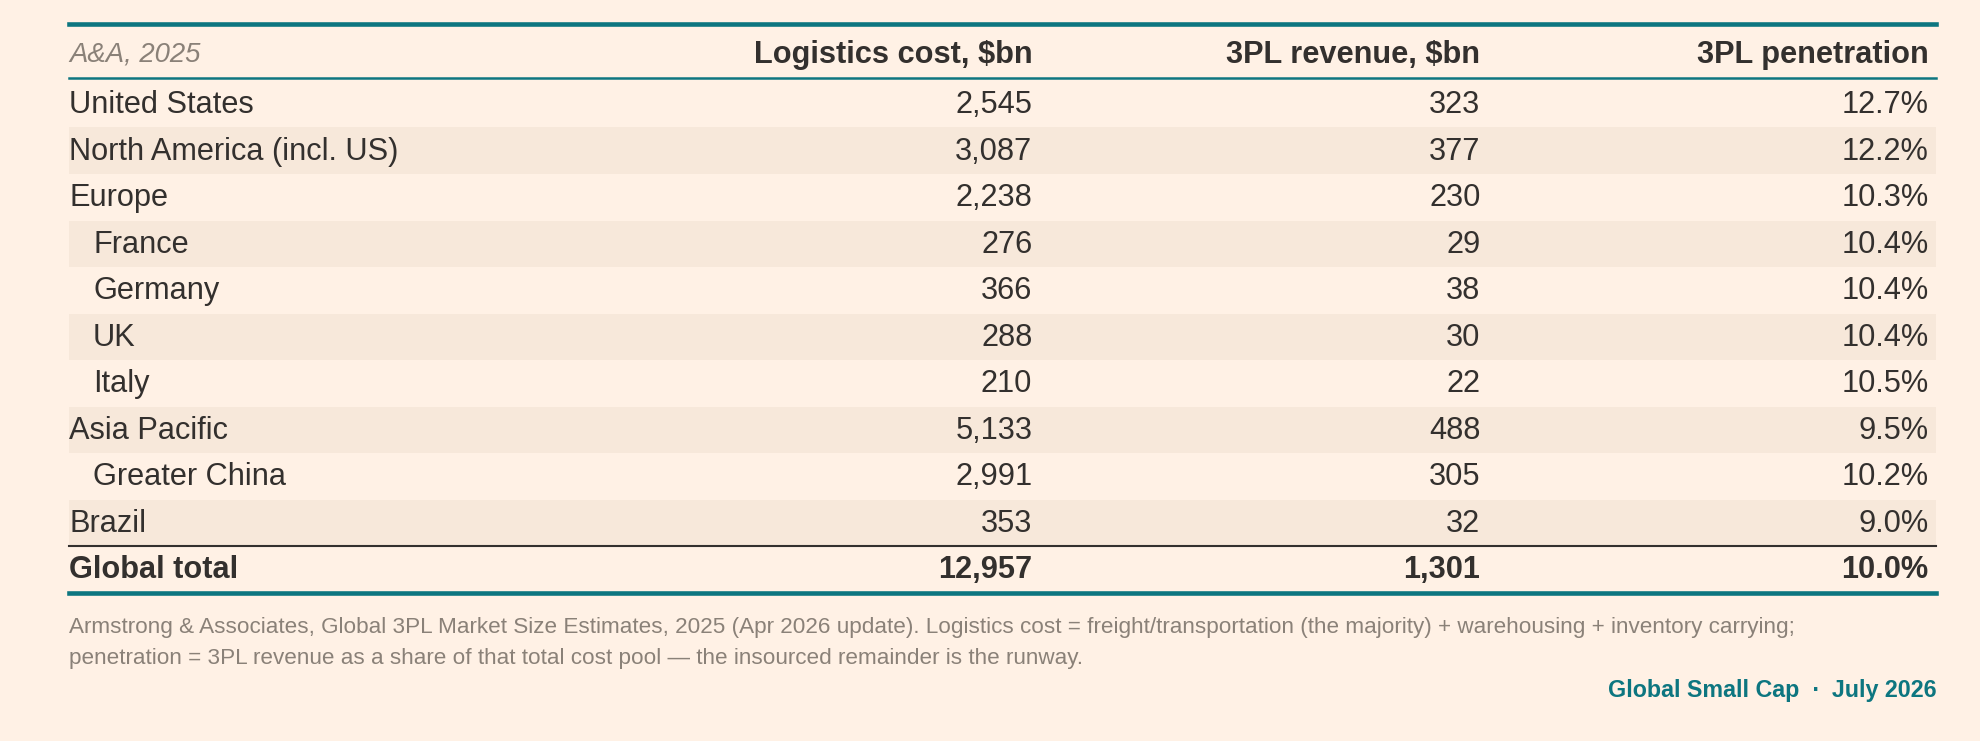
The US represents huge optionality. North America is 19% of revenue growing 30-40% like-for-like, built on Kane (bought for $240m, roughly 1.0x sales, in 2022) plus the Nespresso and Jagged Peak entries before it (more on this later in the report). The US 3PL pool is $323bn with 12.7% outsourcing penetration basically doubling the total addressable market (TAM), competition is thinner than Europe’s with fewer credible players, softer client pressure, better margins — but ID Logistics is at roughly 1% share. The challenge will be exporting IDL’s proven European references and expertise into the US market and doing the right tuck-in deals.
The margin J-curve. Start-up losses are expensed as incurred, so a company launching 25-27 sites a year carries a structural drag, but this unwinds arithmetically: If launches hold steady while revenue compounds mid-teens, the mature-to-ramping mix shifts and the 4.4% group margin grinds toward 5%+ — each 10bp is ~€4m of EBIT, ~6% of net income. In other words, IDL’s look-through earnings are 20%+ higher on a normalized basis.
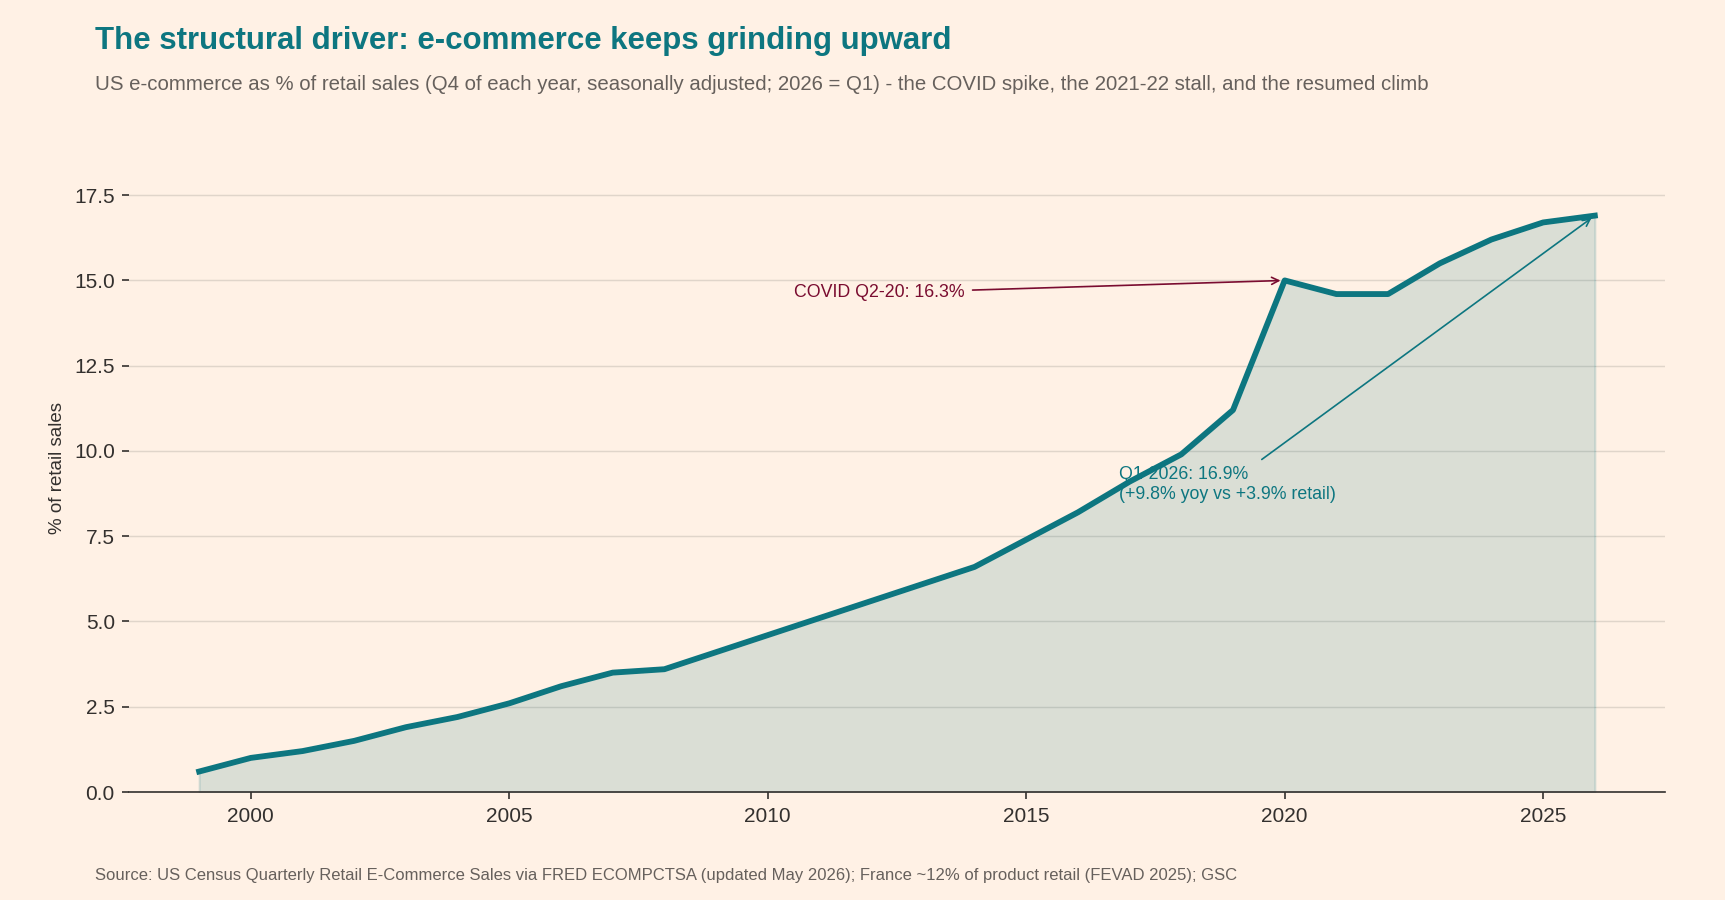
E-commerce outsourcing is re-accelerating. E-commerce is the most warehouse intensive as warehouses take the place of stores, and also absorb much higher return rates. Leaders like IDL are well suited to provide the automation-heavy, 100% accuracy, high-throughput requirements e-commerce demands. After a massive pull-forward in e-commerce during COVID, we saw a post-COVID normalization period. The US Census series maps the arc: e-commerce penetration rose from 11.2% of retail in 2019 to a 16.3% spike in Q2 2020, stalled around 14.6% through 2021-22, then resumed climbing to 16.9% by Q1 2026 — still growing ~2.5x as fast as total retail. IDL’s e-commerce share of revenue peaked around 28% in 2021 before settling near 25%. Then the lull — from spring 2023 Hémar observed “a fall in consumption volumes never seen before” (interview, translated). The recovery is now in the prints, +16.0% like-for-like in 2025 and +17.2% in Q1 2026, with large e-commerce clients accelerating outsourcing again.
What is the bear case?
Amazon is technically a competitor. Amazon has sold logistics for two decades: Fulfillment by Amazon (2006) stores and ships marketplace sellers’ goods; Multi-Channel Fulfillment ships that same inventory for orders placed off Amazon; Buy with Prime (2022) put Prime fulfillment on brands’ own sites; and Supply Chain by Amazon (announced September 2023) bundles logistics end-to-end — factory pickup, cross-border freight, customs, bulk storage, replenishment, delivery — “across all sales channels.” The direction of travel is from small marketplace sellers toward ever-larger brands, and in May 2026 it reached its logical end: Amazon launched Amazon Supply Chain Services (ASCS), an umbrella opening its freight, distribution, fulfillment and parcel network “to businesses of all types and sizes” — Procter & Gamble, 3M, Lands’ End and American Eagle signed up first — pitched explicitly as doing for supply chains what Amazon Web Services did for cloud computing. 3PL share prices fell on the announcement. With that said, it is important to note that Amazon offers shared network capacity on Amazon’s playbook, not a dedicated single-client site, and the brand hands over its channel data. Most large brands and retailers will never hand their supply chains to their fiercest competitor. The Key Risks section takes this apart properly.
US Expansion is Risky. At a high-level, a mid-sized French player trying to land large references in the US is a difficult ask and fits and starts are to be expected. The strategy has three legs. First, buy a platform with references: Kane, at $240m and roughly 1.0x sales, with its management retained to run all of North America. Second, follow existing European clients across: Canada opened in 2025 behind a long-standing global e-commerce client, and the 2020 Nespresso US operations takeover followed a European client into America the same way. Third, keep hunting M&A. Evidence of success thus far: North America is 19% of revenue and has compounded roughly 28% a year like-for-like over the last three years (+12.8% in 2023, +39.3% in 2024, +31.9% in 2025, per company releases), a New Jersey wine-and-spirits site launched in July 2026, and Kane’s leadership has stayed put. However, IDL has yet to obtain a large named US reference win.
European Market May Mature. Europe is already 50% outsourced and while there is still significant room to grow, there is likely a natural ceiling, perhaps in the 65% range, resulting in less of an outsourcing tailwind (offset by low penetration in the US). For example, France’s revenue fell 4.0% in 2023, its first real down-year, and management caps French like-for-like growth in the mid-single digits. Larger players like DHL Supply Chain and KNIN are growing LSD. Some of this is offset by newer markets including Poland and Iberia which keep compounding as well as a return of e-commerce penetration, which in France sits at ~12% of product retail versus ~17% in the US (FEVAD, the French e-commerce federation / US Census). Inflationary cost pressures have historically pushed higher rates of outsourcing.
Margin Volatility. 3PLs can have opaque and heterogeneous contract structures with different mechanisms to fund capex, deal with cost overruns and surges, and index for inflation, which lands with a lag. While IDL has a long track record of execution, there will inevitably be the occasional contract issue over a book this long. Any issue may be made worse by customer concentration — the top three clients are roughly a quarter of revenue. The counterweights: minimum-volume bands, renegotiation rights, and the day-one contract-KPI tracking installed since 2016.
What is the market pricing in, and what is an attractive buy price?
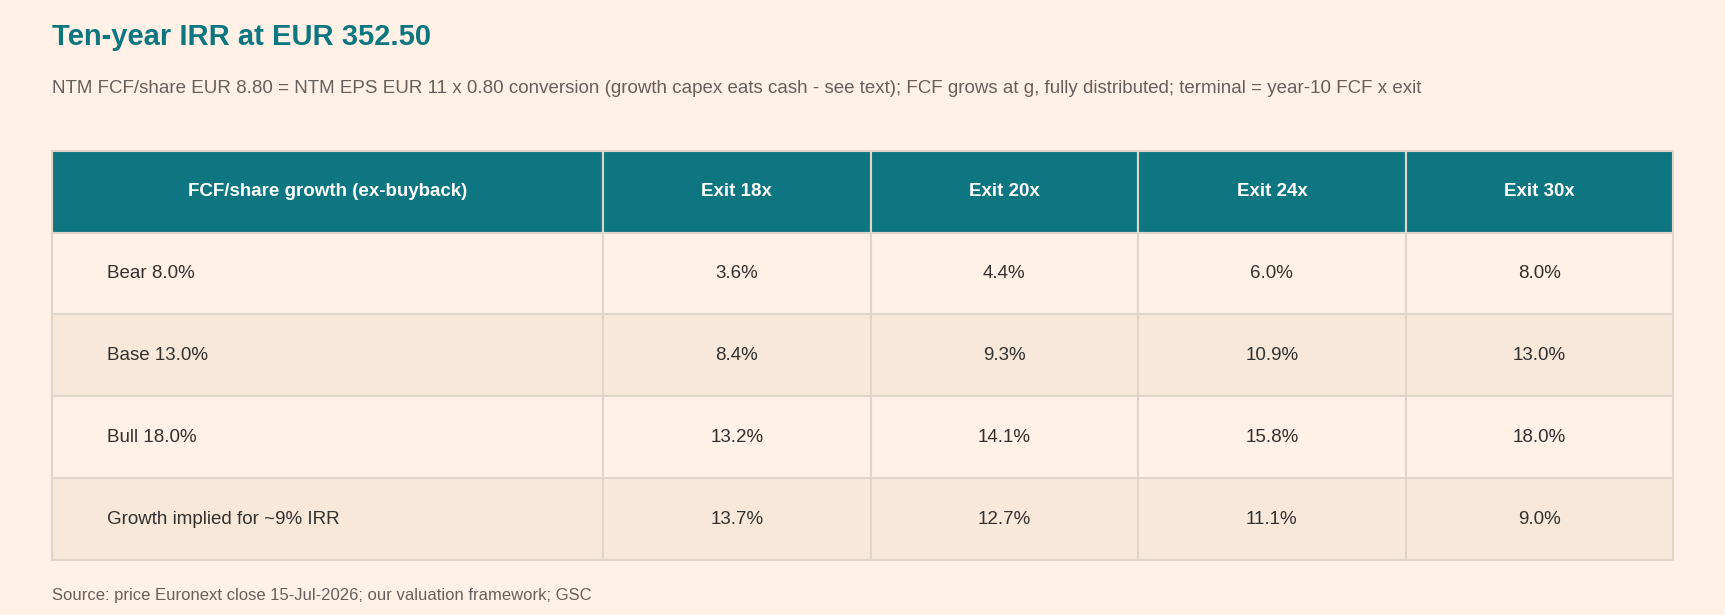
At €352.50 the shares trade at ~32x NTM earnings (€11.0) and ~40x NTM free cash flow per share. Across an 18x to 30x FCF exit grid, the market implies roughly 9-13% annual FCF-per-share growth for a 9% return — the bear-to-base corridor, meaning today’s price already pays for a decade of low-teens compounding.
Using a 15% hurdle, the base case (13% growth, 24x exit) requires entry at ~€257, and a margin-of-safety case (8% growth, 18x) requires ~€148; today’s price delivers ~10.9% on the base case. The 52-week low of €296.50 back-tests to ~13%. ID Logistics is firmly in the “compounder” camp amongst European investors so only earns its hurdle in major market drawdowns or a growth wobble — and our job is to know the business well enough in advance to act inside one.
Converted into an intrinsic value range at a 9% market-style discount rate, the same scenarios are worth roughly: bear ~€230, base ~€410, bull ~€725 per share. At €352.50 the market sits between bear and base.
Industry Primer: Contract Logistics
What do 3PLs do?
Contract logistics companies — also called third-party logistics (3PLs) — design, implement, and run warehouses. The service spans receiving inbound goods, storage and inventory management, picking and packing orders, shipping, co-packing and light assembly, and returns processing. Warehousing used to be simple enough that nearly everyone did it in-house; e-commerce made it exponentially harder. Preparing pallets for a hypermarket tolerates 95% accuracy; preparing single items for consumers requires effectively 100%, plus live inventory data, same-day cutoffs, seasonal peaks, and 25-30% return flows. That complexity — detail picking, automation, specialized WMS functionality — is what pushed retailers and brands toward specialists, and it is why the outsourced share of the market keeps rising.
Why do companies outsource?
Cost. A 3PL pools labor across clients with opposite seasonalities, runs temporary-labor mixes individual companies cannot, and — bluntly, in the French case — pays warehouse staff outside the client’s own union agreements; labor is ~50% of warehouse cost.
Complexity. Automation, e-commerce functionality, and returns engineering now require engineering teams only scale players can carry — a company running one national warehouse cannot justify sixty automation engineers.
Flexibility. An outsourced warehouse converts fixed cost and social risk into an indexed contract that can flex within volume bands. It is kind of like moving from on-prem to SaaS but outsourcing significantly more operational headaches in the process.
How big is the market and how fast is it growing?
Start at the top: A&A estimates the world spent ~$12.96 trillion on logistics in 2025 — about 11% of global GDP — a figure that covers everything: freight and transportation (the majority), warehousing, and inventory carrying. Within that, what shippers actually paid to third parties — global 3PL revenue — was ~$1.30 trillion, roughly 10% penetration of the total cost pool: US $323bn (12.7% penetration), Europe $230bn (10.3%), France $29bn (10.4%).
The ~50% insourced figure quoted earlier is a third, narrower denominator: it is management’s estimate for the warehousing/contract-logistics layer alone — a ~€200bn global pool, its boundary admittedly fuzzy — where Europe is around half outsourced. With the contradiction between 10% and 50%: the first measures penetration of all logistics spend including transport, the second only the warehouse layer where IDL competes.
GXO’s investor materials cut it the same way and serve as the secondary source: “Our total potential addressable market across North America and Europe is approximately $430 billion, including the $130 billion of logistics spend that is currently outsourced and the opportunity for another $300 billion of spend that is currently insourced” (GXO Information Statement, July 2021) — a contract-logistics pool roughly 30% outsourced, with the insourced ~70% explicitly framed as the opportunity which makes sense given GXO’s geographic mix between Europe and the US.
There are two structural drivers. The first: warehousing has become too complex to run as a sideline. Automation hardware, e-commerce order profiles, returns engineering and WMS integration now demand specialist engineering teams that only scale players can carry. Recessions historically accelerate first-time outsourcing as companies convert fixed warehouse cost into an indexed, flexible contract. The second is a related trend which is e-commerce penetration, the most warehouse-intensive form of retail: warehouses replace stores and absorb 25-30% return flows. The US Census series shows the grind — 11.2% of retail in 2019, a 16.3% COVID spike in Q2 2020, a 2021-22 stall around 14.6%, then a resumed climb to 16.9% by Q1 2026, still growing ~2.5x as fast as total retail.
How do the contracts work?
Two families of contract structure exist, and they allocate risk oppositely.
Open-book (cost-plus) contracts, dominant in the UK: every cost passes through to the client, who pays an agreed management fee of roughly 3-10% of costs, with gain-share mechanisms splitting efficiency improvements (i.e. to incentivize efficiency, if you find an investment, process change, etc. that drives efficiency, the 3PL shares in that gain). Low risk, inflation-proof, capital-light, but generally lower margin.
Closed-book contracts, dominant in France and most of Europe and the US: the 3PL commits to a fixed price per task — so much per pallet received, per order picked, per parcel shipped — built up during the tender into a tariff list of 50-80 line items, valid within minimum/maximum volume bands, indexed to wages and input costs. The 3PL keeps efficiency gains between renegotiations, so margins can exceed open-book but the 3PL also has to absorb more operational issues.
ID Logistics is essentially a closed-book operator (with UK-style cost-plus only where local custom demands it). It is important to note that for major errors that make a contract uneconomic, while rare, when it does happen it is generally in the customer’s interest to correct the error and renegotiate as uneconomic contracts may mean the 3PL will provide lower service levels.
In both structures, the 3PL’s fee is a sliver of the supply-chain costs it manages, i.e. if supply chain costs are 10% of opex, a 3PL’s costs would be 3% to 7% of that 10%. A rival offering to halve the fee saves the client perhaps <1% of warehouse costs; if that rival then runs the warehouse even a few percent less efficiently, the saving is gone within the year. Fee discounts cannot compensate for operational inferiority, which is why tenders are won on references and design, and why price is rarely the differentiator.
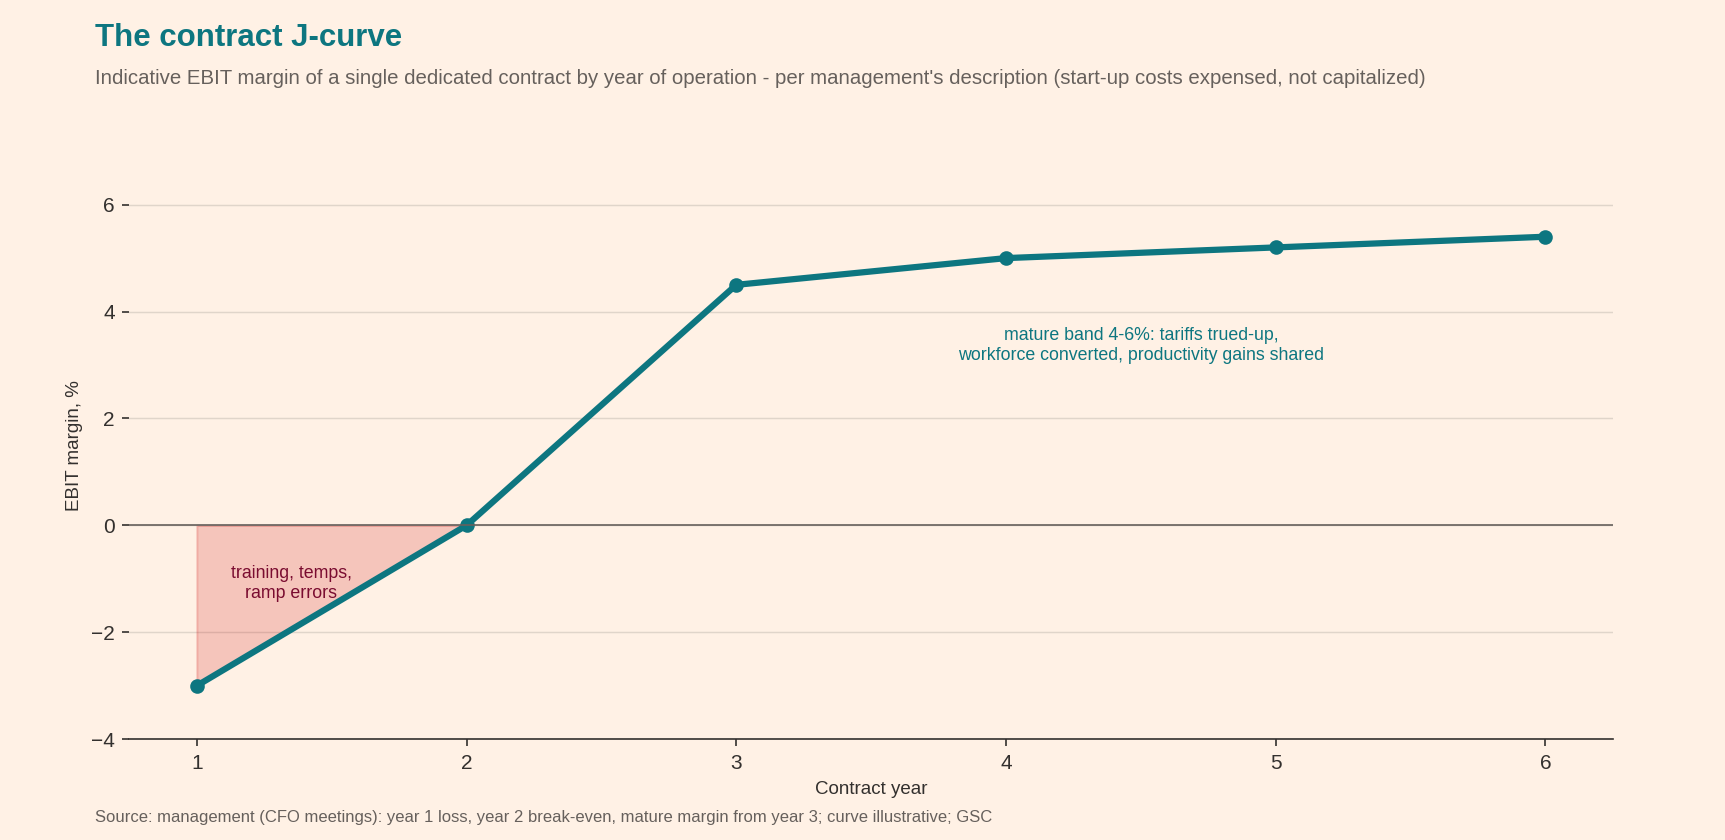
Contracts generally follow a J-Curve for closed-book whereby there is an initial absorption period with full run-rate margins not being achieved till year 3 leading to understated margins for higher-growth players like IDL. To the extent IDL can find efficiencies over time, margins can exceed projections meaningfully by years 4/5/6.
Who are the players?
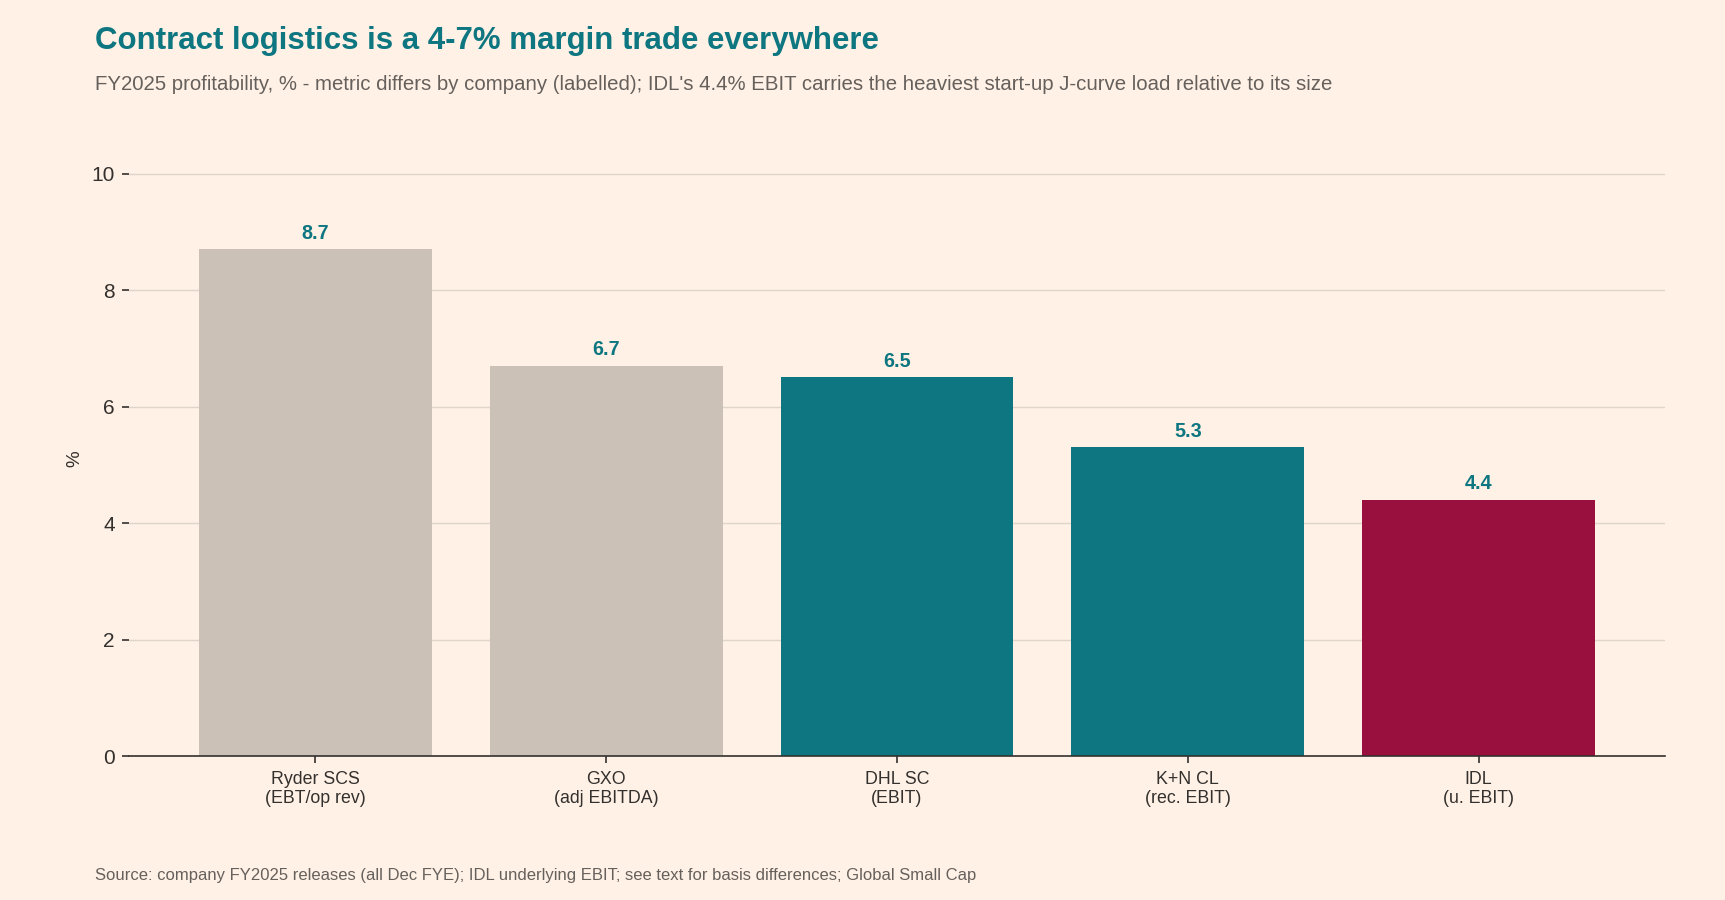
DHL Supply Chain leads globally (€17.8bn revenue, 6.5% EBIT margin in FY2025); GXO is the listed pure-play consolidator ($13.2bn, 6.7% adjusted EBITDA margin, +3.9% organic); Kuehne+Nagel and DSV run contract-logistics divisions beside freight forwarding; CEVA (CMA CGM) and a long tail of nationals and regionals fill out a market where, in most countries, the top ten hold less than half the share. ID Logistics ranks in the global second tier (#42 in A&A’s top-50 by gross revenue) but first-tier in its home market and in growth: it is the fastest-growing sizable pure play in the industry, and the only one compounding revenue mid-teens organically.
Business Overview
ID Logistics reports two segments:
France (€985.3m revenue, €42.8m underlying EBIT, 4.3% margin in FY2025), and
International (€2,751.7m, €122.4m, 4.4%) — eighteen countries beyond home, led by Iberia, Poland, Germany, the UK, Benelux, the US, Brazil and, since 2025, Canada.
International contains both mature national franchises earning French-style margins and ramp-heavy new countries that each take five to six years and seven or eight mature warehouses to absorb their ~€0.5-1m of annual fixed country costs. The group runs ~450 sites; no contract exceeds 5% of sales but the top three clients are roughly a quarter of revenue.
The company does not name the top three. What can be pieced together: the top three were 25.9% of FY2024 revenue across 66 contracts, with one client above 10% (company IFRS 8 disclosure, cited in broker research). Brokers believe the >10% client is Amazon. Carrefour is almost certainly a second — the financial press headlines IDL as the company that manages “les entrepôts d’Amazon et de Carrefour dans 19 pays” (Boursorama, May 2026). The third cannot be identified from public sources; the long-standing FMCG and retail names — Danone, Groupement des Mousquetaires, Auchan, Nespresso — are the candidates.
France (26% of revenue; 4.3% margin)
France is the original founding geography where IDL provides dedicated-site contract logistics for a blue-chip client base — mass retail (Carrefour, Auchan), fast-moving consumer goods (FMCG: Danone, Nivea), cosmetics and premium brands (Nespresso), e-commerce pure players (Amazon), healthcare — plus Colisweb, a French last-mile specialist acquired in 2022 (€24m enterprise value plus an earn-out that was largely reversed) that delivers by appointment in two-hour slots, including heavy items up to 1,800kg. France is the source of significant references which help IDL expand both domestically and overseas.
The business was founded in 2001 and built up gradually but deepened significantly with the 2013 acquisition of CEPL for undisclosed terms (leverage was 1.7x EBITDA after the deal), which brought the mechanized, small-item skills that later powered the e-commerce franchise.
The price can be bracketed, not confirmed. Net financial debt rose from €8.9m at end-2012 to €86.6m at end-2013 (1.7x EBITDA) in a year when operations generated cash, implying an all-in outlay — equity plus assumed debt — of roughly €80-90m, or ~0.4-0.5x CEPL’s ~€180m of revenue (broker figure). The €28.6m of ex-CEPL warehouse disposals booked in 2015 lowered the effective price further. An inference from the balance-sheet delta, not a disclosure.
France’s margin (4.3%), for its part, is structurally capped rather than cyclically depressed: the market is mature, labor is among the most expensive and most regulated in Europe, and the client mix leans toward mass retail, which pays the thinnest margins. What France offers instead is stability — its cohorts are old, its productivity gains compound, leading to relatively stable margins every year.
The main issue is macro: French consumption volumes, which fell in 2023 for the first time in Hémar’s telling, cap like-for-like growth in the mid-single digits. Historically the segment has delivered roughly 5-6% a year — from ~€684m in 2018 to €985.3m in 2025, with the cycle visible inside it (-4.0% in 2023, +5.0% in 2024, then a +13.5% rebound in 2025). Going forward, management expects France to normalize back to mid-single-digit like-for-like growth (roughly +3-5% in the 2026 framing; Q1 2026 printed +4.9%).

International (74% of revenue; 4.4% margin)
IDL built out its international business primarily organically by leveraging existing client relationships. IDL’s strategy has been to enter a country only when a client contract anchors it. It has then added to this with M&A to “acquire references” — Logiters (2016, €85m EV) made it an Iberian leader and added healthcare; GVT (2021, €67.7m) built Benelux; and Kane (2022, details below) created the US platform; Spedimex (2023, €74m EV, paid 70% in IDL shares) made it Poland’s leader in fashion and e-commerce logistics.
Country-level revenue is not fully disclosed. The URD gives four zones (FY2025): France €985.3m (26%), Europe ex-France €1,773.2m (48%), North America €699.8m (19%), rest of world €278.7m (7%). Within Europe ex-France no country split is published; broker estimates put Brazil at 5-6% of group revenue and the US at ~19-21%, with Iberia, Poland, Germany, the UK and Benelux the bulk of the European remainder (broker estimates). Market positions are a partial proxy: #1 in France (~9% share), #2 in Spain (~10%), #1 in Poland (>10%), ~top-10 in Germany (broker estimates).
Within international, Iberia and Poland are mature franchises; the US and Brazil are compounding at 30-40% like-for-like; Canada, the UK and Germany are still absorbing country fixed costs. The segment’s 4.4% margin already matches France despite that mix — the arithmetic case for group margins grinding higher as cohorts season.
International matching France’s margin despite being less mature is a mix effect. The segment nets mature franchises earning above-France margins — Iberia, Poland, and a structurally richer US market — against ramping countries still absorbing fixed costs. In 2023, when a lighter launch calendar diluted it less, International printed 4.7% against France’s 4.2%.

The transformative deal: Kane Logistics (2022)
In February 2022, IDL agreed to buy 100% of Kane Logistics — a US contract-logistics pure play founded 1930, owned since 2019 by Harkness Capital — for a $240m enterprise value in cash, against $235m of 2021 revenue: roughly 1.0x sales for a business growing 20% a year. Kane had twenty hubs across Pennsylvania, Georgia, Ohio, Illinois and California.
The logic: the US was the industry’s largest and most profitable pool, ID Logistics’ prior footholds (Jagged Peak 2019, the Nespresso operations takeover 2020) were platforms without scale, and Kane’s management — who had run Jacobson under Norbert Dentressangle a decade earlier and therefore knew the model — wanted an industrial buyer rather than another fund (note Norbert Dentressangle eventually became the core of GXO’s 3PL business and was where prior GXO CEO Malcolm Wilson rose-up).
The company financed Kane plus Colisweb (the last-mile acquisition described in the France section) with a €400m syndicated loan and let leverage peak at 2.6x pre-IFRS16 at closing, back below 2x within the year.
From Kane’s $235m of 2021 revenue — which landed on top of IDL’s own pre-Kane North American base of roughly €80-100m (Jagged Peak was ~$80m of revenue at acquisition, plus the Nespresso operations; broker estimates — the segment was not separately disclosed then) — the North American business reached ~€710m by FY2025, roughly triple Kane’s acquired revenue in euro terms — 19% of group revenue — with like-for-like growth compounding through it: +12.8% in 2023 (when the US was 14% of revenue), +39.3% in 2024, +31.9% in 2025 and +40.6% in Q1 2026. Kane’s CEO still runs the region and the acquisition has been undoubtedly a success.

While the growth has been impressive, IDL is still a relatively small player in the US without a marquee reference like Nike or Amazon. Recent wins include a New Jersey wine-and-spirits site announced in July 2026. Management has been explicit in saying they are looking for additional tuck-in deals.
Suppliers & Technology
The inputs are labor, leased space, and increasingly automation. IDL rents warehouses back-to-back with contracts meaning if the client terminates, the lease typically also terminates. Equipment is often also leased back-to-back with a client contract. Labor is really the main input. IDL has to hire and maintain the labor and is protected from having to rapidly scale down permanent labour with minimum volume bands. Thereafter, roughly 28% of staff are temporary, letting sites flex.
Automation was the main trend over the last 10 years and AI and the potential for AI-powered robots has only accelerated this trend. IDL thinks of itself as a technology integrator rather than an owner of software or hardware. IDL has relationships with major automation equipment suppliers (AutoStore-class cube storage, Scallog/Knapp-class goods-to-person robots, AMRs), charges the equipment to the client, and differentiates on the engineering judgment of what actually pays back.
Management is openly skeptical of automation bought for its own sake, noting many clients never see the ROI and that flexibility (adding or removing capacity mid-contract) is what vendors must now deliver.
About 30% of its warehouses are automated, against roughly 10% for warehouses globally. The WMS strategy is flexible: no in-house system, full fluency in Manhattan, Reflex, Generix and clients’ own systems — the flexibility that, by management’s account, won IKEA’s e-commerce across eight Northern European countries against DHL and KNIN, both wedded to proprietary platforms.
AI has so far been used for labor planning, slotting, and digital-twin site design. However, once humanoid robots become viable, it is easy to see how experts like IDL will be brought in to select vendors, program robots, and manage a non-human labour fleet, expertise which IDL can apply across multiple customers and sites, but the hype is ahead of reality today.
Competition
The freight-forwarding and parcel giants. Nearly all of them carry in-house 3PL divisions with global footprints, but for most, contract logistics is not the core focus — the strategic logic is synergy with forwarding, parcel and ocean businesses.
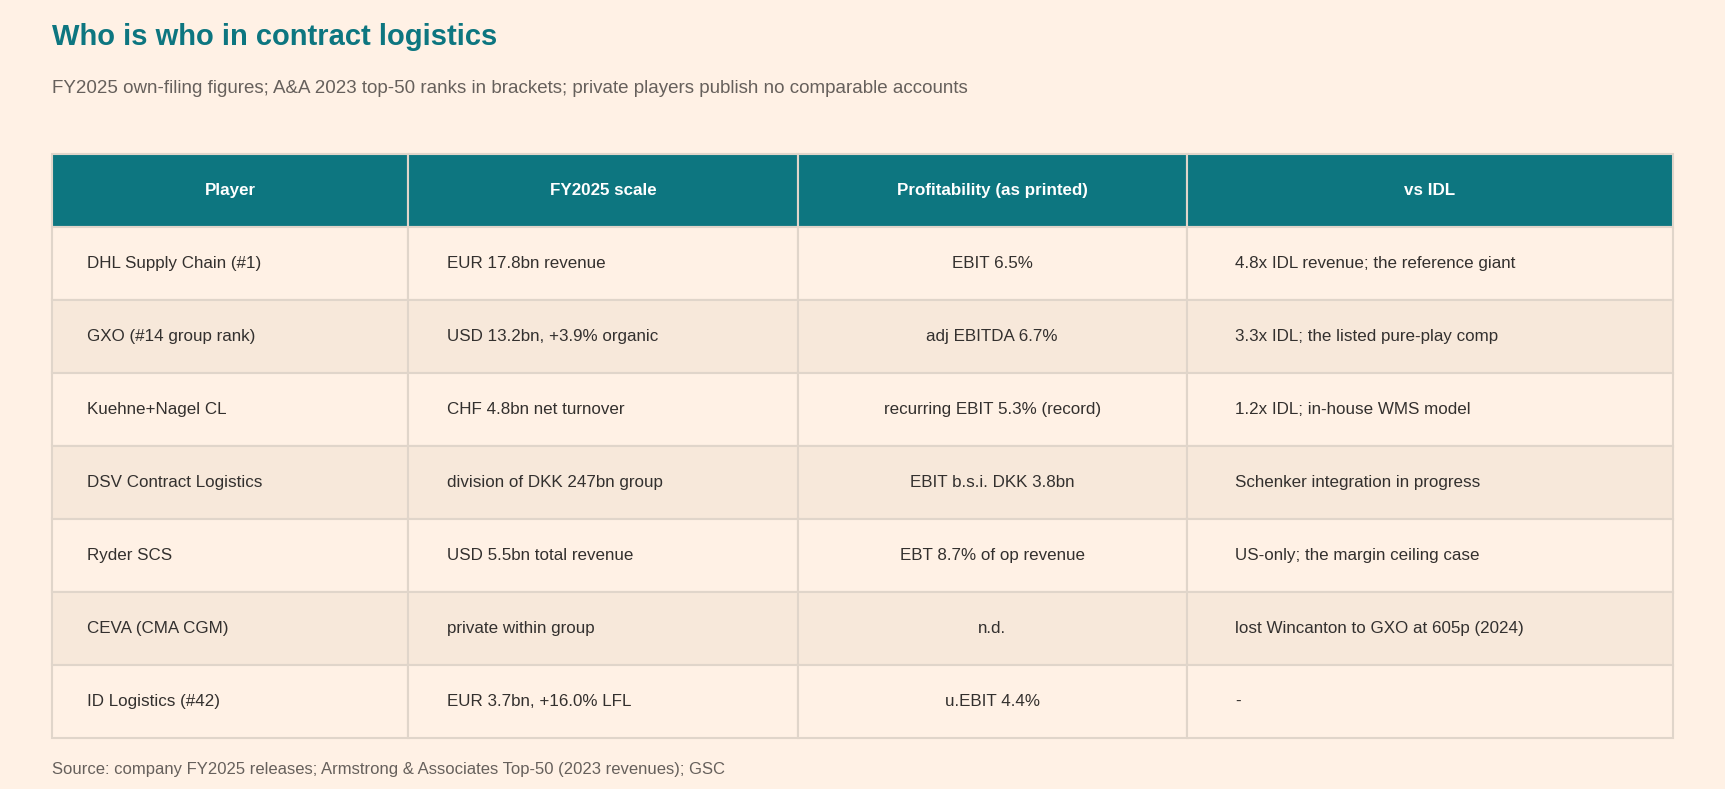
DHL Supply Chain is the clear leader (€17.8bn revenue, 6.5% EBIT margin in FY2025). They are known to have strong references and be very capable but with the normal big-company issues: slow, lots of silos, lack of flexibility, and as a result, growth tends to mirror rather than exceed market growth.
KNIN has been retreating in contract logistics (it sold the bulk of its UK book to GXO in 2020) as 3PLs are seen as a completely different skillset to freight forwarding (managing shipping containers), again disproving that synergies actually exist.
DSV is digesting Schenker; CEVA (CMA CGM) acquires aggressively where ocean tie-ins matter. None of them treats warehouse operations as its main event, which is precisely IDL’s opening.
IDL competes head-on with all of these players but its pure play status and reputation gives it a competitive advantage, especially in Europe allowing it to win heavyweight contracts from the likes of Amazon, Carrefour, and Ikea.
GXO — the closest pure-play. GXO is the direct comparable and the head-to-head competitor in every large European tender. GXO runs 200+ French sites, it is the strongest player in the UK (nearly half of its revenue: $6.3bn of $13.2bn in FY2025 per its 10-K) and top-tier in the US. In my view, there is not necessarily any huge differentiation between GXO and IDL across Europe with GXO clearly having a lead in the UK.
At a company-wide level, the structural differences are contract mix and posture. GXO runs roughly 45% open-book (given its UK exposure) while IDL runs an essentially closed-book model. GXO also operates a multi-tenant arm (GXO Direct) that IDL deliberately avoids as low-stickiness.
When comparing margins, GXO capitalizes contract start-up costs where IDL expenses them (see Unit Economics), which flatters comparative margins during growth. GXO has also, likely a function of scale, grown in the MSD with MSD/HSD ambitions, below what IDL has consistently achieved.
The real share-donors. The competitors IDL and GXO actually takes revenue from are the long tail of small 3PLs — Arvato, FIEGE and Culina-type national players and thousands of local operators. There is a large fragmented middle that increasingly loses on exactly the dimensions tenders now weigh: contract governance, automation and WMS engineering depth, and multi-country references. Every point of that share shifts to the scaled specialists, and IDL’s growth premium over the market is mostly this transfer.
The verdict: ID Logistics is the growth outlier in an “established players” plus “very long-tail” structure. DHL Supply Chain (4.8x IDL’s revenue) is the reference giant; GXO (3.3x) is the listed consolidator whose organic growth (+3.9% in FY2025) runs slower to IDL’s pace; and KNIN and DSV run contract logistics as divisions with in-house-WMS models that are not the core focus. Against all of them GXO and ID Logistics compete as the pure-play specialists.
The Moat
The moat is the same four components introduced in the Investment Case — references and track record, dedicated-site switching costs, IT-agnosticism, and labour management expertise. Against GXO or DHL Supply Chain the moat is roughly at parity — all three carry the references, the switching costs and the technology depth, and tenders between them are decided on design, price and site leadership rather than on moat. The significant moat is against the regional champions and small players losing share, who can match none of the four at scale.
Unit Economics
During a 12-18 month tender and implementation phase, ID Logistics and the client co-design the site, agree on volumes, and convert the total cost — labor, lease, equipment, energy, overhead allocation, margin — into a tariff per task: so much to receive a pallet, store it, pick a line, pack a parcel, process a return. The client is invoiced monthly on volumes executed; minimum/maximum bands bracket the tariffs’ validity; indexation clauses reprice wages and inflation annually.
If volumes go outside the bands, the contract renegotiates (management claims about five failed renegotiations in five years). Because temporary labor is 28% of the workforce, simplistically, the lower band might be 28% below projected volumes meaning if volumes fall short, IDL can protect margins by cutting temporary labor and if volumes fall short by more than 28%, IDL’s margins contract structure protects it.
Roughly 60% of costs are variable. The J-curve is the model’s signature: all start-up costs are expensed as incurred (training, temp-heavy ramps, productivity gaps against tender assumptions), so a new site loses money for 12-24 months, breaks even in year two, and reaches the mature 4-6% EBIT band in year three.
GXO accounts for this differently: its 10-K states that the company “capitalizes direct and incremental costs incurred to obtain and to fulfill a contract in advance of revenue recognition, such as certain labor, third-party service and related product costs,” recognizing them as contract assets “amortized to Direct operating expense... over the contract term” (GXO 10-K FY2025, significant accounting policies). IDL expenses the same start-up costs as incurred, so during growth phases like-for-like margins understate IDL relative to GXO — a comparability point, not a quality one.
Sizing it: the company does not disclose start-up costs, so this is an estimate. At 25-27 launches a year and a first-year loss in the €1-2m range per site, expensed ramp costs run roughly €35-40m a year — about 1% of revenue and roughly a quarter of underlying EBIT. Restating underlying EBIT GXO-style — adding back each year’s expensed start-up costs and charging a five-year amortization of the current and prior cohorts instead:
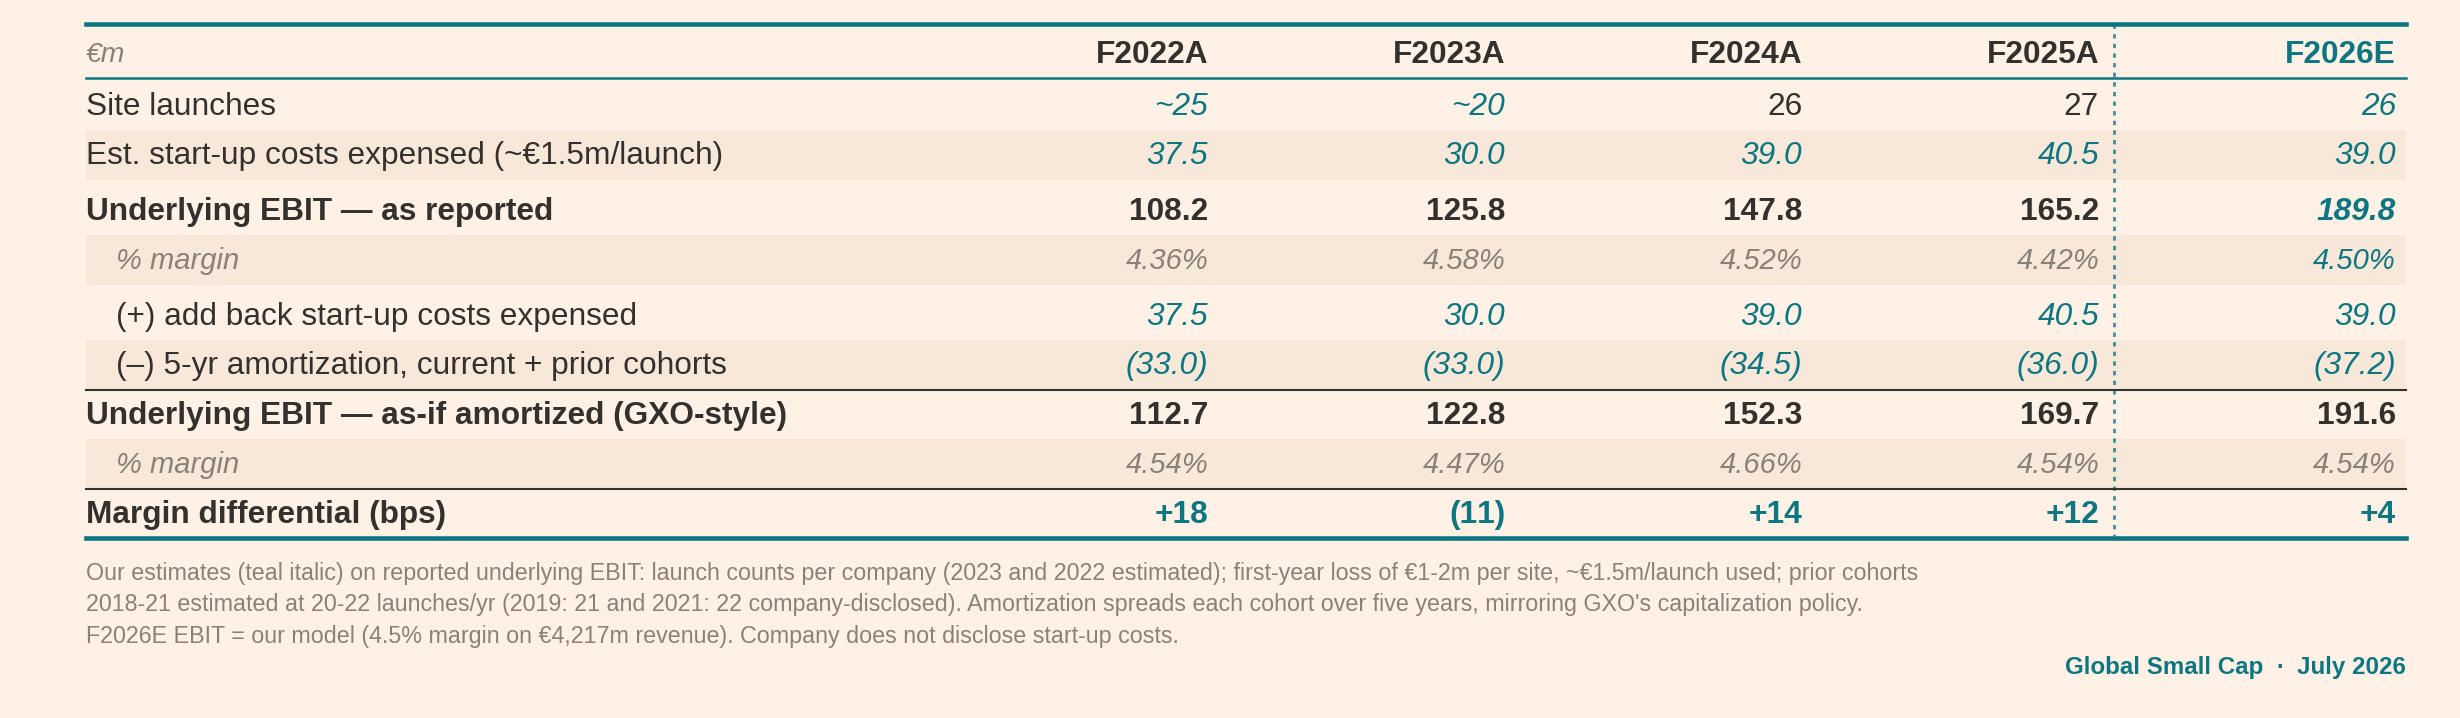
The margin differential is small — inside roughly 10-30bps in either direction, and only +4bps on 2026E — because the launch cadence is steady: with a flat cohort, the five-year amortization of prior launches nearly equals the current year’s expense, and in 2023, a lighter launch year, amortized accounting would actually have lowered the margin by 11bps. Capitalization flatters most when launches accelerate — which is exactly when GXO-style accounting is least comparable, and exactly what would happen if IDL stepped up its growth. The bigger point stays with the look-through arithmetic: the ~€40m expensed each year is the cost of growth, and it is a quarter of EBIT.
A detailed breakdown:
Labor ~50% (of which ~28% of total workforce is temporary)
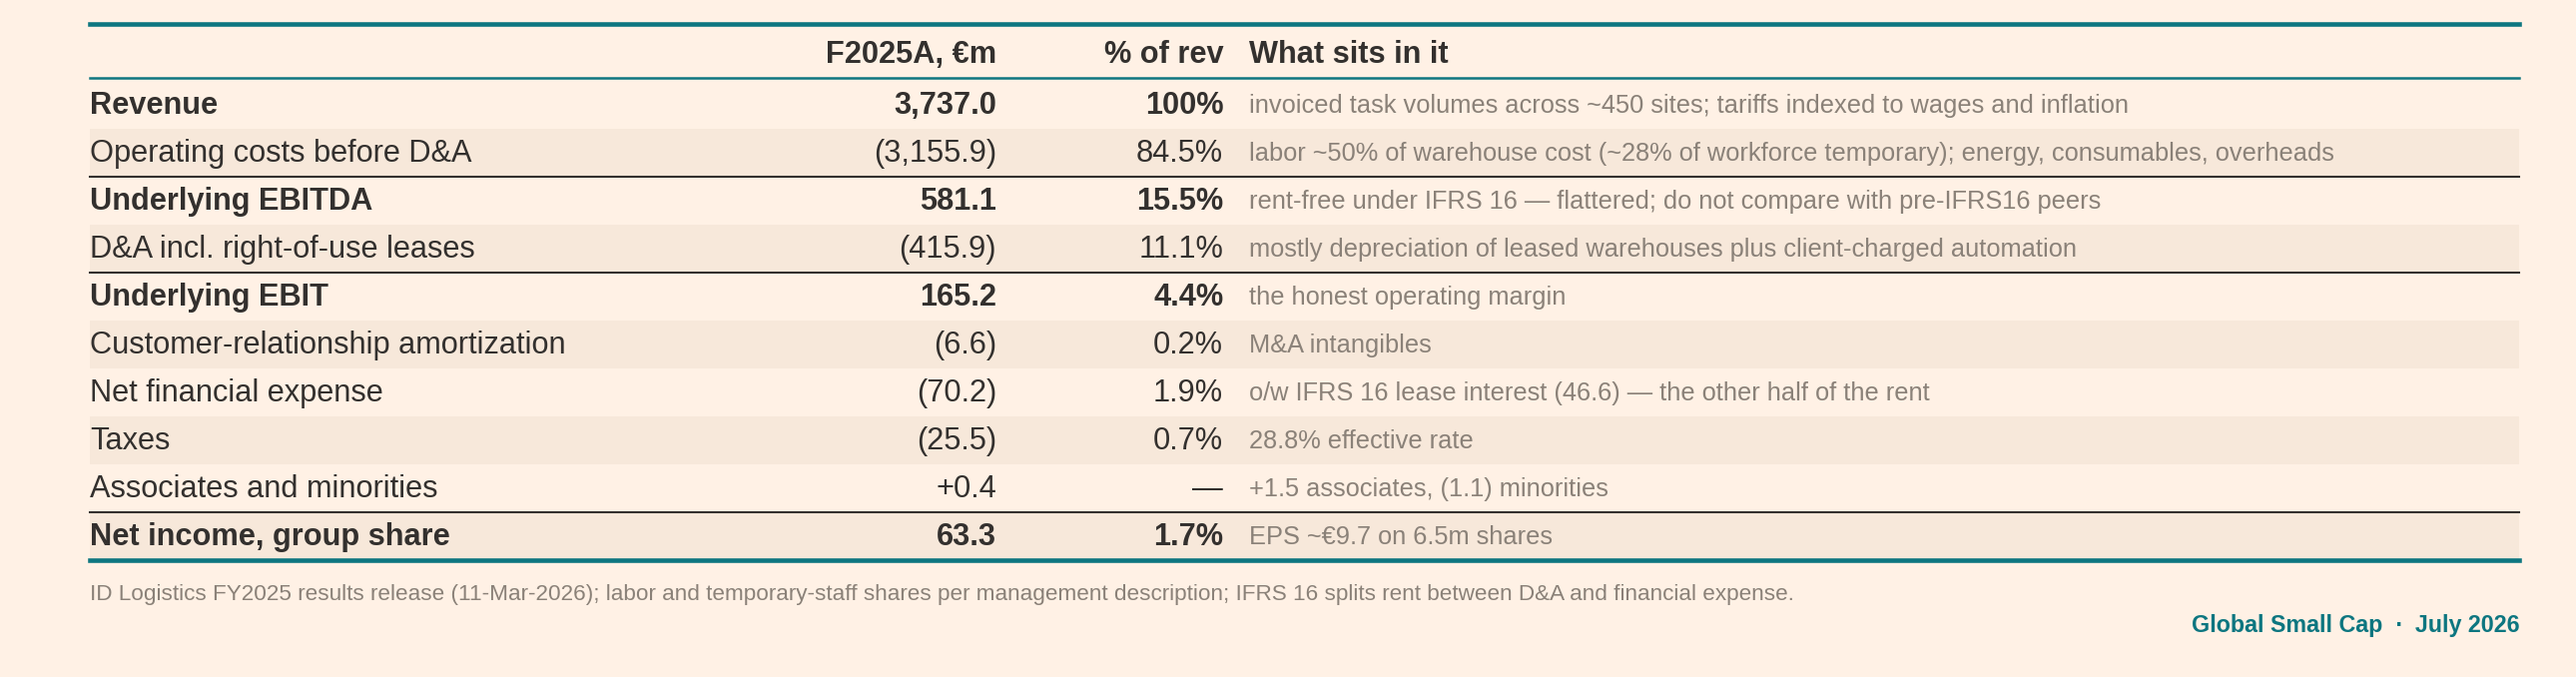
Leases and equipment rentals (IFRS16 moves these into EBITDA — hence 15.5% EBITDA against 4.4% EBIT; the 11-point wedge is mostly depreciation of leases and client-charged automation).
The lease liabilities sit on IDL’s balance sheet, but they are co-terminous and back-to-back with the client contracts, so the obligation is economically the client’s commitment rather than IDL’s speculative exposure. The residual risk is a client bankruptcy mid-contract — and even then, landlord contracts commonly contain provisions for that case, and a well-located warehouse is re-lettable.
Energy and consumables, then country overheads form the rest.
Cyclicality
New contracts
Outsourcing itself is countercyclical: downturns put cost pressure on customers who then look to convert a fixed warehouse cost into an indexed, flexible contract— management’s experience is that cost pressure accelerates first-time outsourcing. But decisions slow even as the logic strengthens, so wins lag the cycle: 2009-class recessions stopped tenders industry-wide. COVID added a distortion of its own: the e-commerce pull-forward produced +7.1% revenue growth and a margin rise in 2020 as launches surged, then several years of normalization — but in a normal cycle, new tenders accelerate leading to an acceleration in growth coming out of the recession.
Existing sites
Revenue on running sites tracks the physical volume of goods handled, which is less volatile than the value of goods, and minimum-volume bands floor the first leg of any shock — though in a downturn volumes run nearer that floor. The 2023 consumer-volume decline — the first Hémar had ever seen — is the live example of the potential cyclicality: France printed a -4.0% revenue year while International compounded through it.
Key Risks
The risks below mirror the bear case at the top of the document, with Amazon first because it appears in the case three times over.
1. Amazon — client, competitor, and precedent. Amazon is the only name in the book that is simultaneously a top-tier client, a declared competitor, and the industry’s insourcing cautionary tale.
Amazon as client. The top three clients are roughly a quarter of revenue and Amazon is one of them (perhaps ~8-10% of revenue). The relationship began with the 2017 French tender and now spans six countries, built on the operations Amazon structurally does not want in its own standardized network — oversized, hazardous, low automation fit — and on record site-opening speed (Milan, under two months). Management caps the exposure deliberately.
Amazon as competitor. The two-decade escalation — Fulfillment by Amazon (FBA, 2006), Multi-Channel Fulfillment, Buy with Prime (2022), Supply Chain by Amazon (September 2023) — culminated in the May 2026 launch of Amazon Supply Chain Services, which packages freight, distribution, fulfillment and parcel “to businesses of all types and sizes” (first sign-ups: Procter & Gamble, 3M, Lands’ End, American Eagle) with an explicit AWS-for-supply-chains framing; FreightWaves read it as largely a rebrand of existing arms under one console, but 3PL share prices fell on the news.
Amazon can plausibly run logistics 3-6% cheaper on modern, non-union infrastructure and could let AWS/E-Comm profits subsidize the offer. However, it is worth noting that the contracts it has outsourced to the likes of IDL are based on heavy/bulky operations because they do not naturally fit Amazon’s network. It is also very unlikely that Amazon will begin building out the sales team, engineering team, and dedicated integration teams to go after entire non-Amazon sites, IDL’s bread and butter. Most clients would be reluctant to depend on a competitor to that extent.
Amazon as precedent. There is real risk that Amazon uses IDL to learn the heavy/bulky category, build its own facilities in the same industrial parks, then take the operations in-house. Amazon contracts might run 3 to 5 years so there is real risk. With that said, the reference benefits Amazon brings are invaluable and worth the risk of losing 8% to 10% of revenue over time.
2. The US fails to scale beyond mid-tier clients. As of today, IDL is still a relatively small player in the US. North America is 19% of revenue growing 30-40% but this growth is being driven off a small base and wins of mid-tier distributors rather than landmark new logos. With that said, IDL has had three years of 30%+ compounding, Kane management has been retained, Canada opened behind an anchor client, and the margin structure (US contract logistics pays better than Europe) means even moderate success is accretive.
3. A J-curve accident. The mechanism is documented by the company’s own history: when launch intensity outruns the mature base — 2016’s 31 launches — expensed ramp costs and tender-versus-reality gaps crush reported earnings before renegotiations catch up. Quantification: net income roughly halved in the 2016 episode (management account), and today a comparable shock to the 4.4% margin — say 60bp — removes ~€22m of EBIT, a third of net income. The counterargument: the company institutionalized the lesson (day-one contract-KPI tracking, more aggressive renegotiation posture, launch counts held at 25-27 against a base several times 2016’s size), and France’s 2025 productivity print shows the cohort machine working as designed.
4. European maturation. Europe is already ~50% outsourced against a natural ceiling perhaps in the 65% range, France’s 2023 (-4.0%) showed what a mature market’s down-year looks like, and the giants’ contract-logistics arms grow low-single-digit. Quantification: Europe including France is 74% of revenue; if its growth converges toward the market’s 4-6%, the group algorithm leans entirely on the US and margin. Counterargument: Poland and Iberia keep compounding, French e-commerce penetration (~12% of product retail) still trails the US (~17%), and inflationary cost pressure historically pushes outsourcing up, not down.
5. Key man and float. Hémar co-founded the company, chairs and runs it, and controls ~50.4% of the capital; the float is ~47%, the market cap €2.3bn, and the CFO (Yann Perot) has carried the finance function for over a decade. A succession event would test a stock priced for execution. Counterargument: the model is process-heavy and decentralized by country; Satin and long-tenured country managers exist; and the controlling stake is also the reason the company has never chased quarterly optics — no dividend, no buyback, every euro reinvested.
Management & Capital Allocation
Eric Hémar, a graduate of ENA, France’s elite civil-service academy left the Cour des Comptes for the transport ministry and then Geodis, whose logistics arm he ran before founding ID Logistics at 38 with Christophe Satin in 2001. Eric still chairs and runs the company and holds ~50.4% of it — a stake he increased in 2023 by folding his sub-holding position into IDL shares.
The capital-allocation record is straightforward. No dividend has ever been paid, no buyback run; every euro of operating cash and both equity events (the 2012 IPO, the €132.6m September 2024 raise) funded launches and seven acquisitions. Tuck-in M&A strategically makes sense as it is a way to gain references then build-off those references leveraging IDL’s greater scale, technology, and expertise.
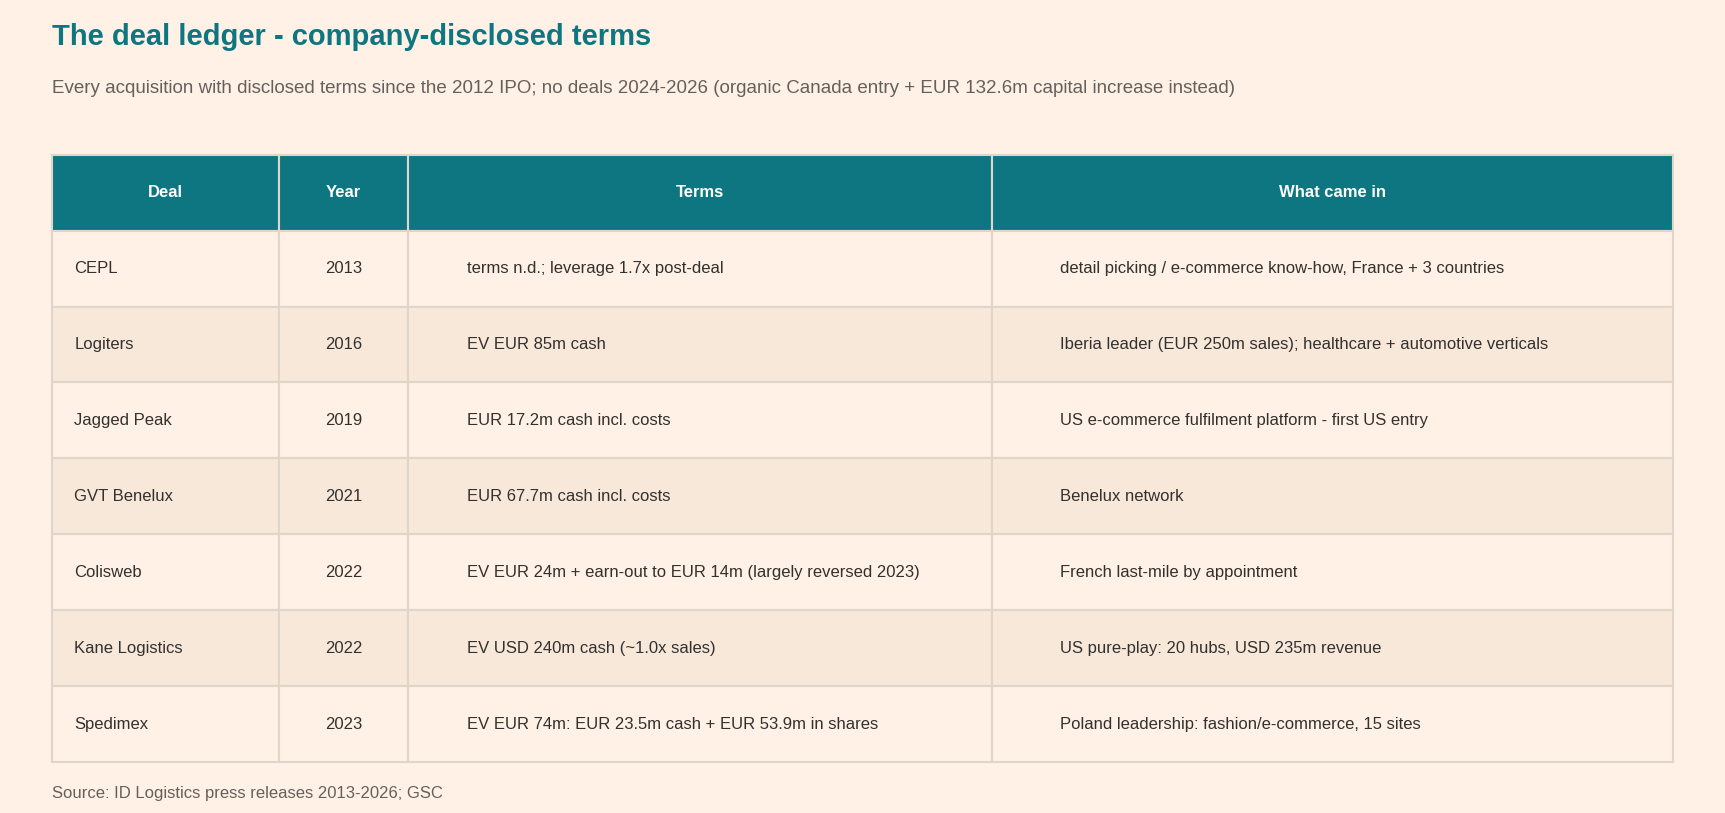
The deal ledger below shows the pattern — small, reference-buying, self-sourced (never brokered, by management’s account), paid in cash except where a founder-seller was wanted as a shareholder (Spedimex’s founder took 3.2% of IDL). Multiples paid ran ~7-7.5x EBITDA in the 2010s (9x for Germany-quality assets, management noted then), and roughly 1.0x sales for Kane. Kane is the one larger deal but the results so far point to very strong success.
Deals stopped entirely 2024-2026 while the US digested. Hémar to Zonebourse (May 2026, translated) points at Canada, England, and the US for more tuck-in deals, which makes sense.
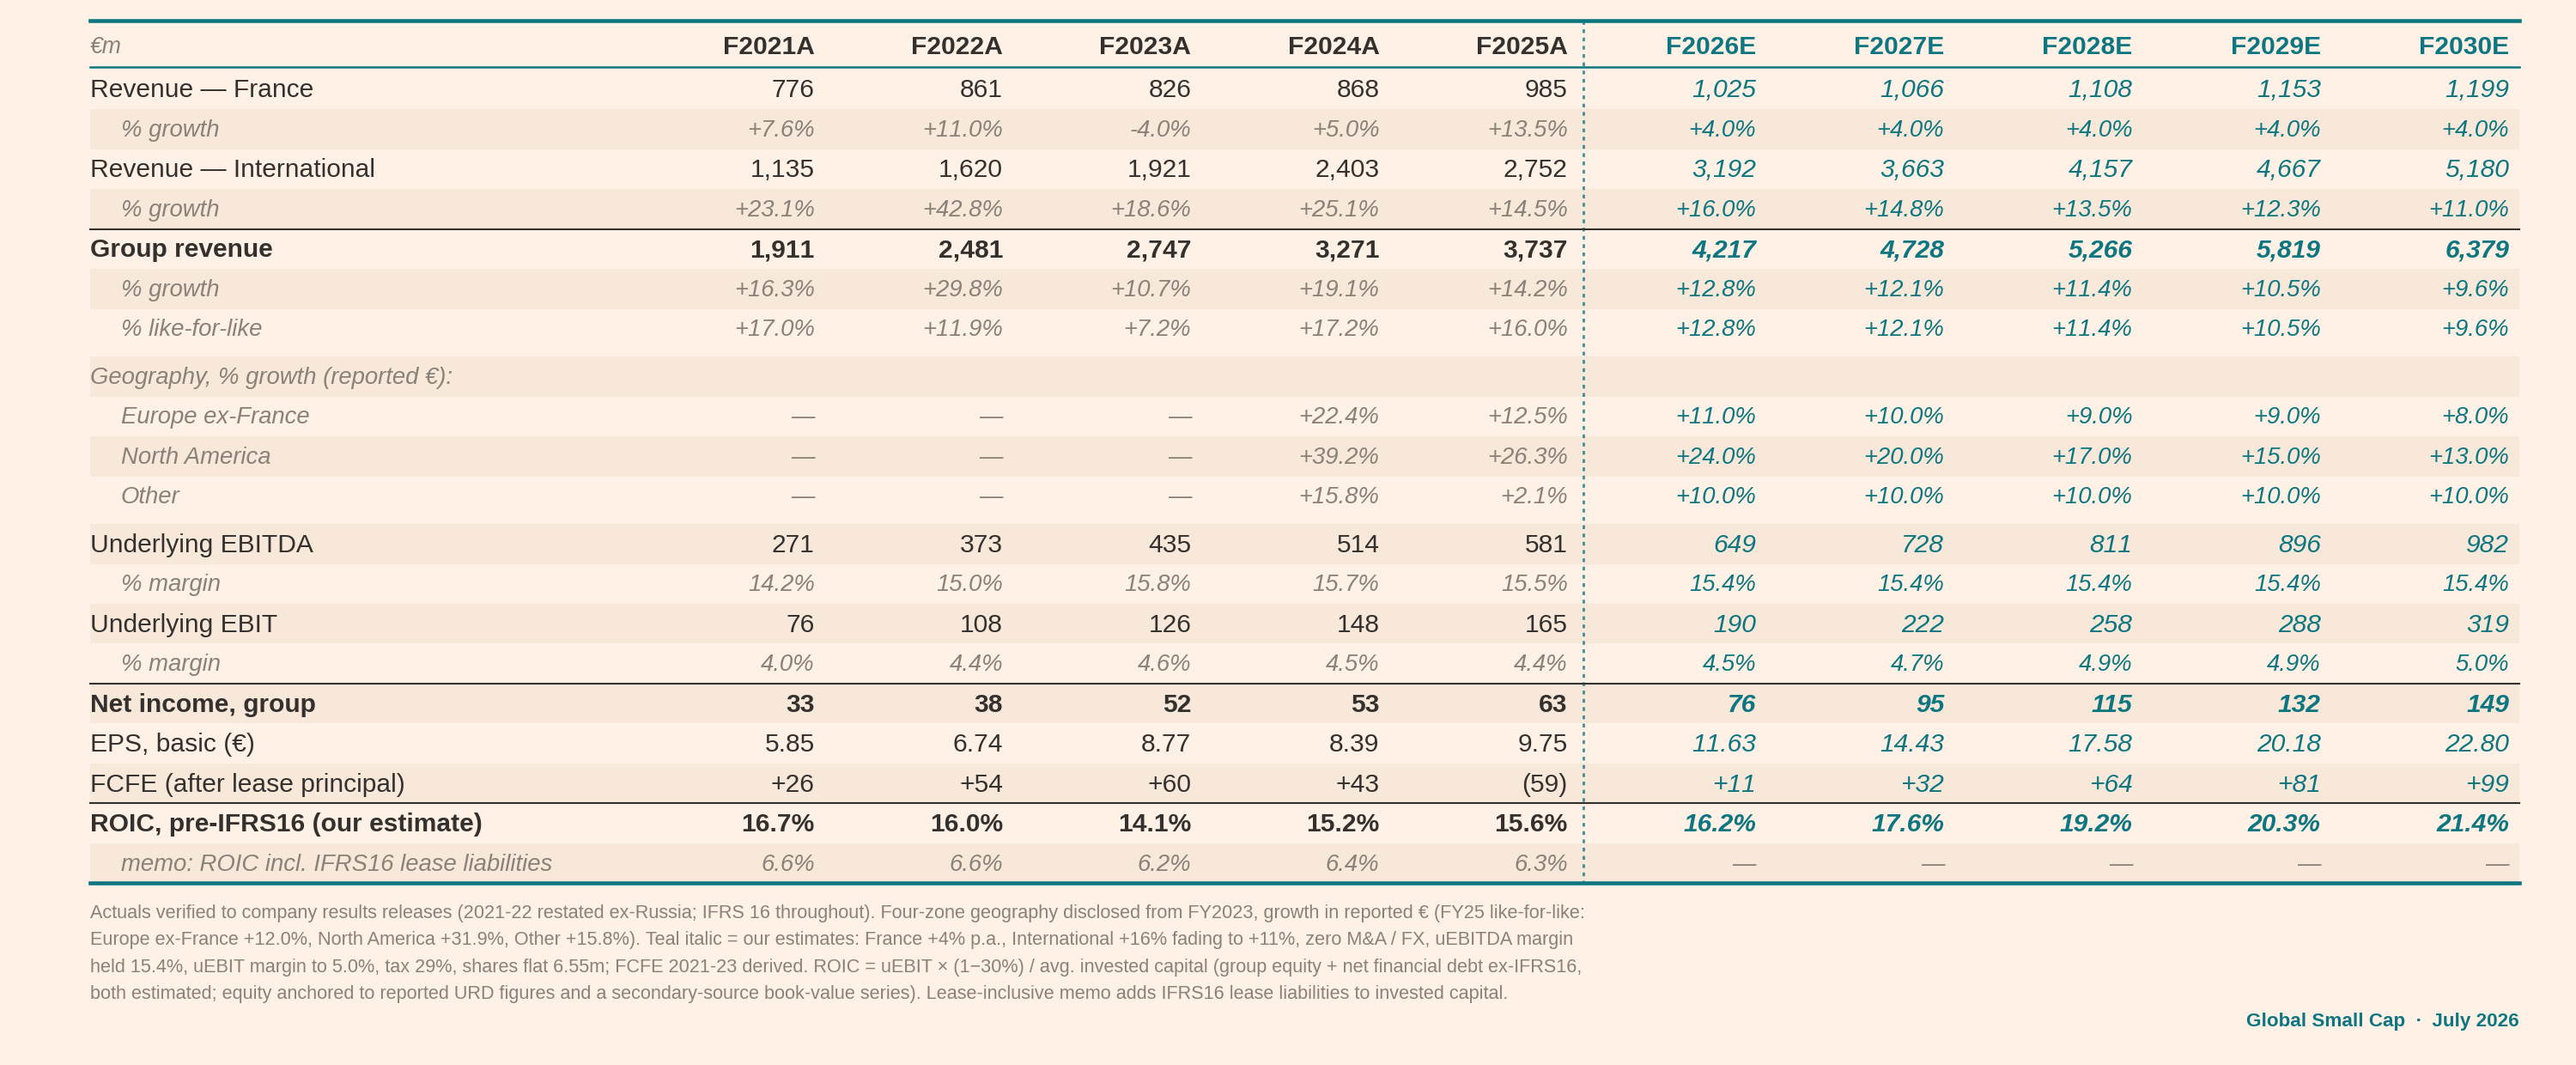
Returns on capital. ID Logistics earns mid-teens returns on the capital it actually employs and deploys substantially all FCF into that return. ROIC has run 14-17% every year since 2020: 15.2% (2020), 16.7% (2021), 16.0% (2022), 14.1% (2023), 15.2% (2024), 15.6% (2025). The trend is stable-to-rising: the dip to 14.1% in 2023 was the France down-year, and the model’s margin walk lifts ROIC toward ~16% in 2026E and the high teens by 2030E as cohorts mature.
ROIC on M&A (our derivation): the deal ledger sums to roughly €500m of enterprise value — Logiters €85m, GVT €67.7m, Colisweb €24m, Kane ~€225m ($240m), Spedimex €74m, plus Jagged Peak’s €17.2m. Over the same arc, International underlying EBIT built from €13.8m (2018) to €122.4m (2025): €108.6m of added EBIT, ~€76m post-tax at the same notional 30% — which, if credited entirely to the deals, would be a ~15% post-tax return on the ~€500m spent. Organic and acquired growth cannot be fully separated so the deals’ standalone return is lower than 15% while their strategic return is arguably higher. What can be said cleanly: none of the seven deals has been written off or exited, the entry multiples were disciplined (~7-7.5x EBITDA in the 2010s, ~1.0x sales for Kane), and the blended machine — buy references cheaply, then compound organically off them — has converted that outlay into an International segment earning €122m of EBIT while group ROIC never left the mid-teens.
Incentives: the family stake is the alignment; disclosed executive pay is modest. The detail, from a secondary compilation of URD data: Hémar’s total compensation was ~€1.2m for 2024, of which ~€700k fixed salary, up 14% year-on-year. The incentive driver is the stake itself: no dividend has ever been paid, so the founder’s payoff is entirely the compounding of the equity.
Growth Algorithm
There are several parts.
TAM (3% to 4%). Logistics spending itself grows with nominal GDP — call it 3-4% (the cost pool is ~11% of global GDP, and A&A measured the 3PL market up 3.4% in 2024 through a soft freight year).
Outsourcing (1% to 2%). On top of that sits outsourcing penetration: management’s decomposition makes rising penetration roughly half of the 3PL market’s 4-6% growth.
Geographic Mix (1%+). Europe’s contract-logistics market (74% of revenue including France) grows roughly 4-5% a year, the US market roughly 5-7% (lower penetration, faster e-commerce), Latin America high single digits in nominal terms (our estimates, anchored on A&A and company market-growth figures). Footprint-weighted, IDL’s end-markets grow ~5-6% — but if IDL executes, the Geographic mix will turn more favorable over time.
Share Gains (6% to 8%). Then IDL’s own share gains — a tender pipeline of 160-200 RFPs (requests for proposals) a year converted into 25-27 launches, which took global share from 0.2% in 2009 to ~1.1% by 2023 — add the rest, roughly six to eight points. This is where the regional prints belong: the US and Latin America compounding at 30-40% like-for-like against end-markets growing 5-7%, and Europe growing low teens against a 4-5% market, are share capture, not market growth.
The stack sums to roughly 11-14% top-line growth, which is where guidance (11-13%) and the recent prints (+16.0% in 2025) sit. Below the line, margin maturation from 4.4% toward ~5.0% as cohorts season adds two to three points of EBIT growth over revenue resulting in earnings compounding mid-to-high teens.

The e-commerce driver deserves its chart here, because it powers three of the five layers at once — market growth, penetration, and IDL’s share of wins (e-commerce is a third of the tender pipeline):
Management’s arithmetic, in its own words: “We set ourselves an objective of doubling our revenue every 5 years. A trajectory that should allow us to reach €4 billion of revenue in 2026” — Eric Hémar, Supply Chain Village (January 2026, translated) link — an ambition the 2026 guidance (11-13% like-for-like, 25-27 launches, margin consolidation at 4.5-4.6%) makes concrete.
M&A is episodic and additive. The end-result: revenue 15.7% CAGR 2012-2025; net income 23.4% CAGR 2012-2025 and 11.5% from 2015; underlying EBIT 15.3% from 2015.
Key Assumptions
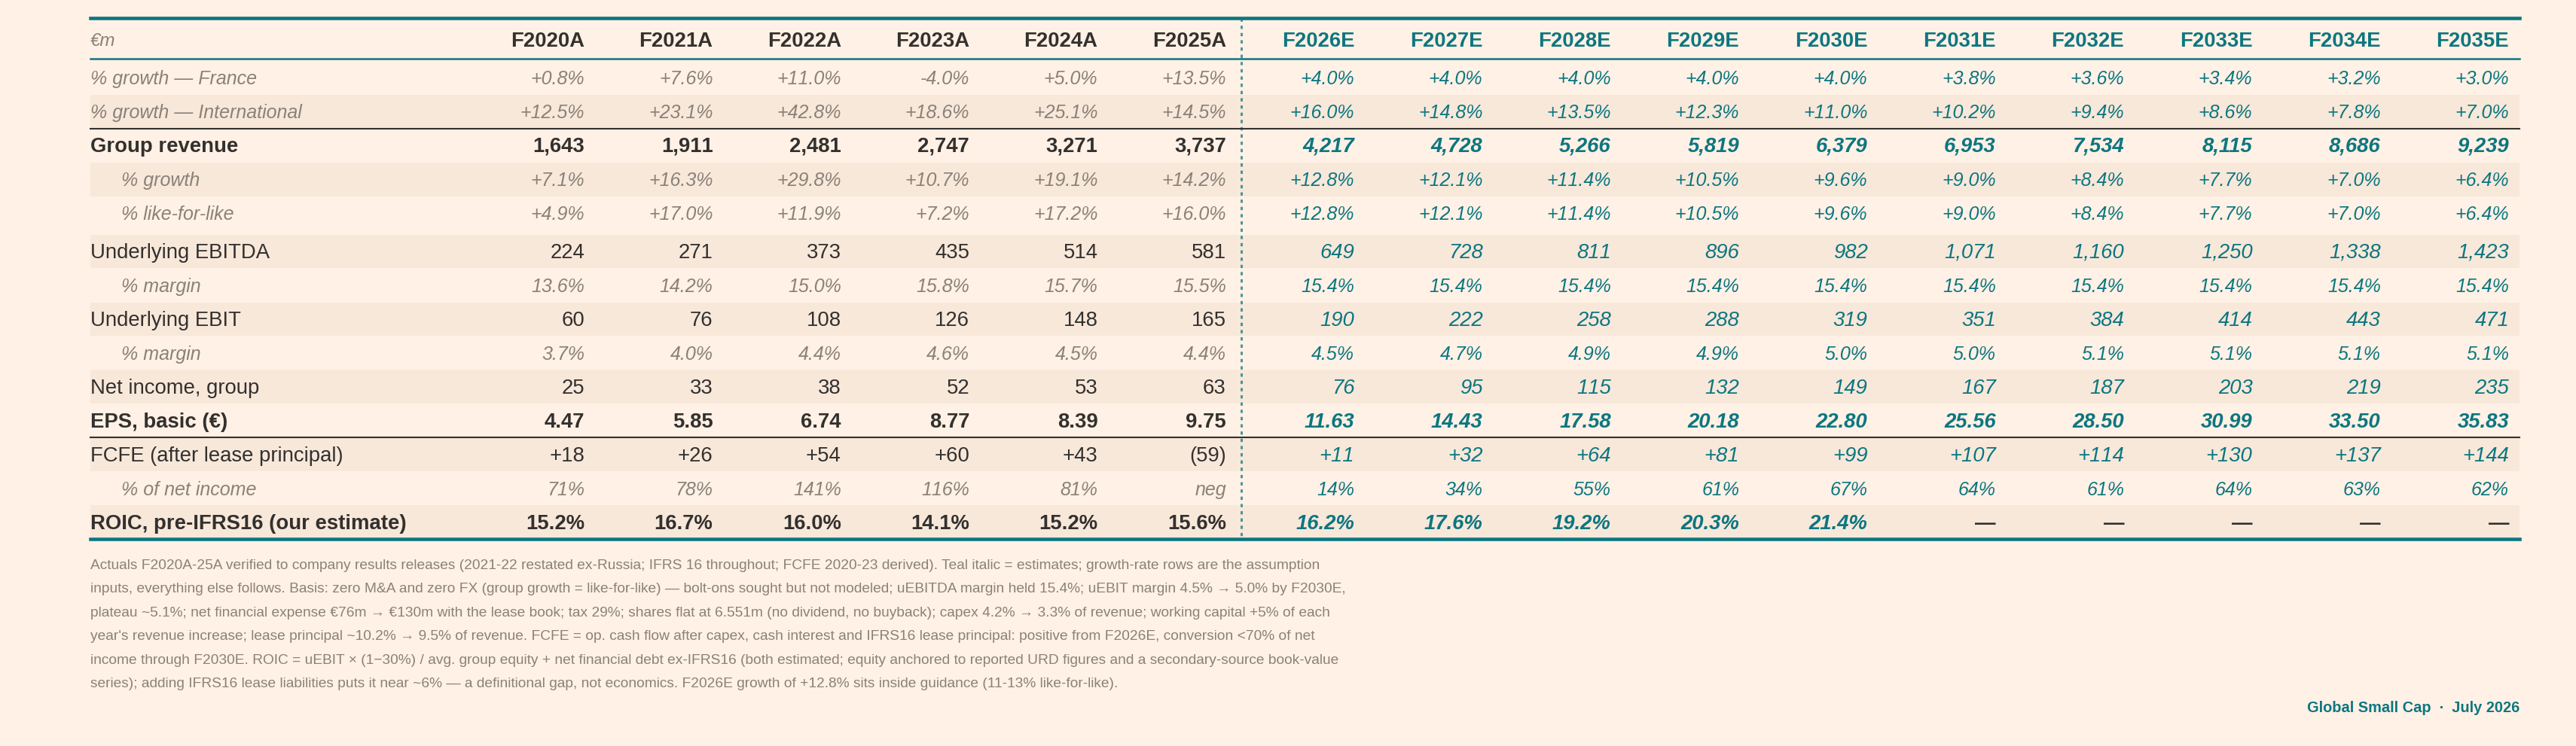
The assumptions and the model summary in one place — teal italic marks the assumption inputs and estimates; everything else follows from them. The basis notes at the foot of the table carry the detail.
Valuation — and What Is a Sensible Buy Price
Reading the grid: the market implies ~9-13% FCF/share growth for a 9% return.
The base case (13%, 24x) returns ~10.9% from €352.50;
The bear case (8%, 18x) ~3.6%;
The bull case (18%, 30x) ~18.0%.
I think a reasonable entry price is in the €257 range, comfortably clearing 15% but also assuming that a relatively high multiple will hold. The key pushback is that GXO, a larger more mature player has not sustained a mid-20’x multiple but has in fact seen significant margin volatility. A back-up-the-truck price may be closer to €213 which underwrites to a 15% IRR to a 18x exit multiple.
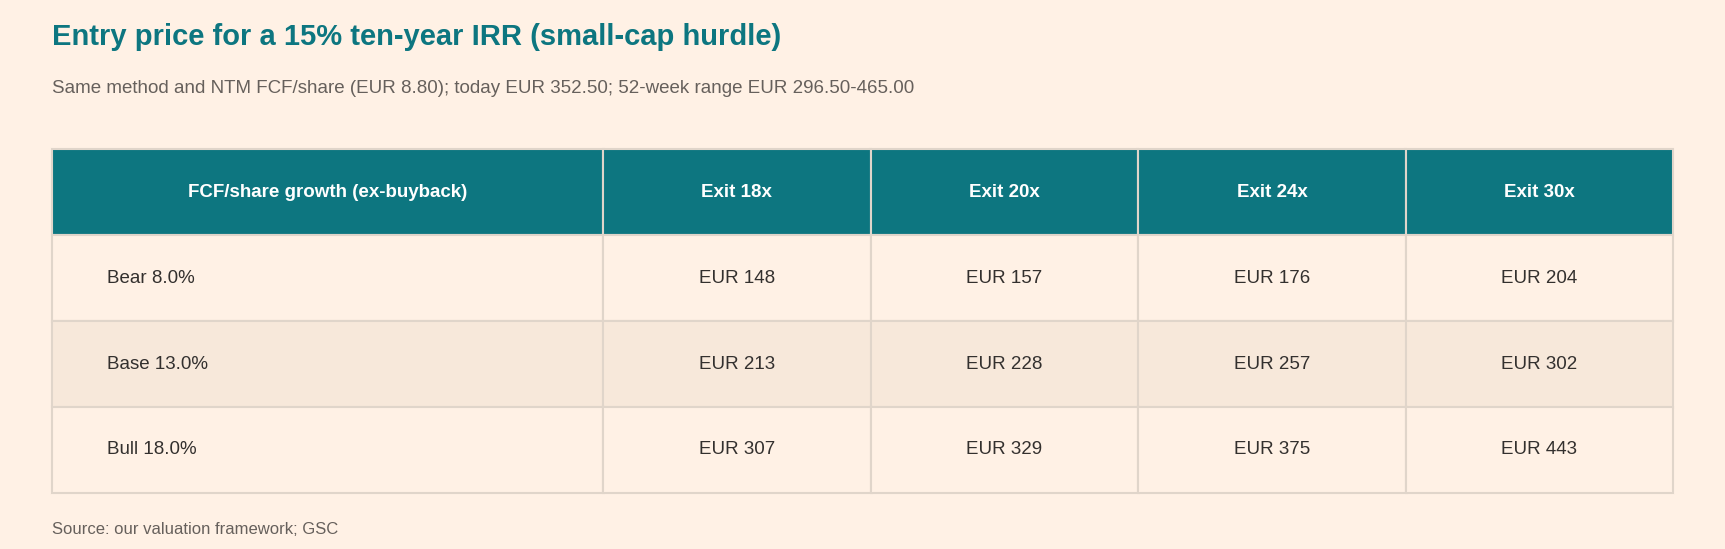
The 52-week low of €296.50 back-tested to ~13.1% — the market closed much of the gap to the hurdle price during a mere sentiment wobble. There may be opportunities given the relatively thin float. At €352 the shares pay ~11% for a business executing at its best — a fair return.
EPA:IDL, ENXTPA:IDL, EURONEXT:IDL, IDL.PA and $IDL. ISIN: FR0010929125.